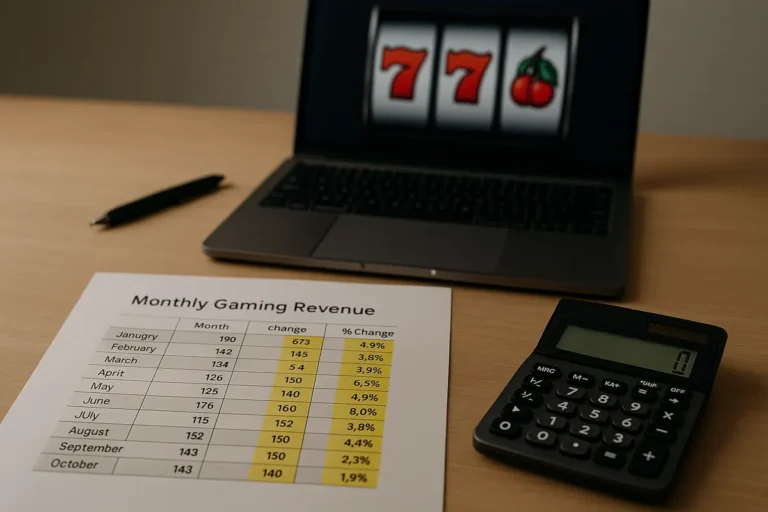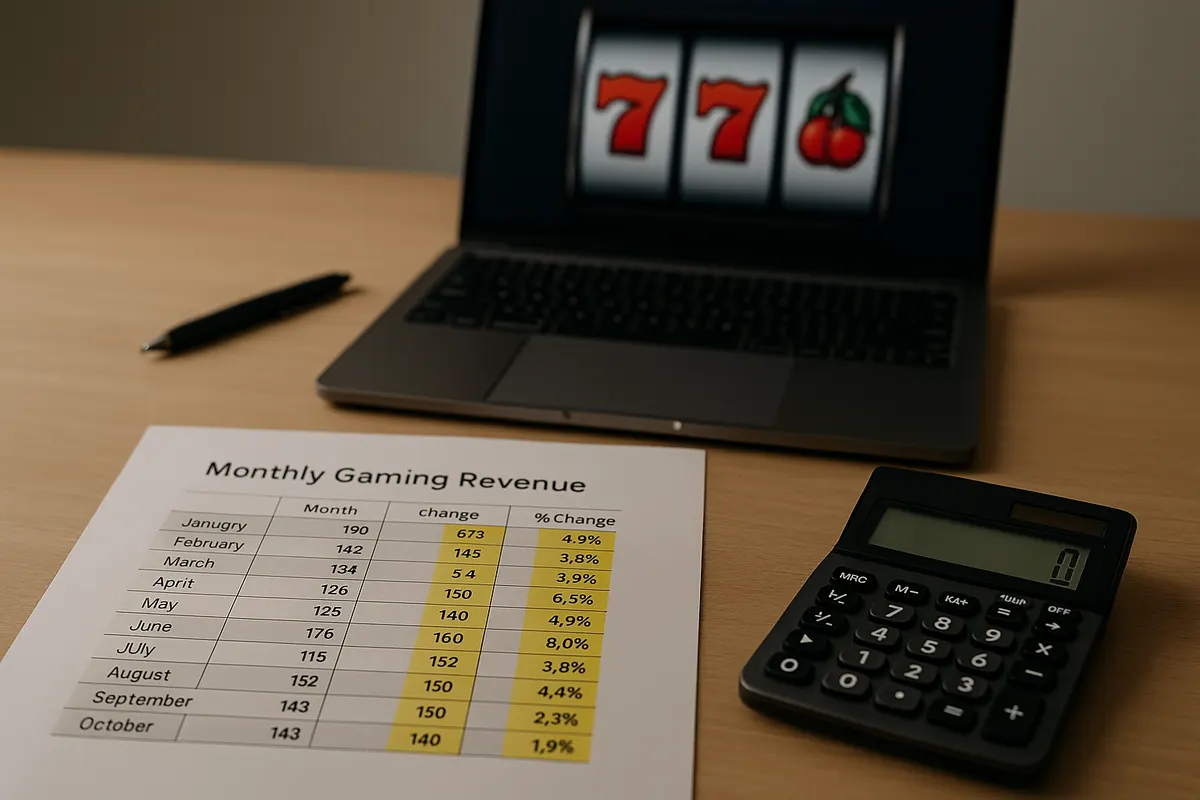
One-cent slots produced $12.9 million of the $17 million that Deadwood’s casinos reported for August. That is about 76% of an entire gambling town’s monthly take, coming from machines with the smallest denomination on the floor. If that surprises you, it is a good sign you will get something out of learning to read a casino revenue report properly, because the headline that ran everywhere, “Deadwood casino revenue rises 8.2% to $17 million,” told you almost none of that.
Revenue reports are the most reliable public window into how a gambling market is actually performing. They are also widely misread. Below are the assumptions that trip people up most often, corrected with the real South Dakota figures for August.
Understanding casino revenue reports: the basics
A monthly casino revenue report is a regulator’s tally of how much money licensed operators kept from players over a calendar month, usually broken out by game type and compared against the same month a year earlier. It is a compliance document first, a market indicator second, which is why the presentation is dry and the detail is genuinely useful.
What gets measured in gaming revenue
The measured figure is the operator’s win, not the total amount wagered. Players feed far more money through a slot machine than the casino keeps, because most of every wagered rupee or dollar cycles back out as payouts. A machine running at 92% RTP returns about $92 of every $100 wagered over the long run and retains roughly $8. That retained slice, aggregated across every machine and table, is what shows up in the report.
Reports typically split revenue by category (slots versus table games), and often by denomination or individual game. South Dakota’s release goes down to the penny: $1 slots at $814,994, city slots at $657,086, 25-cent slots at $340,383, blackjack at $830,757, house-banked poker at $685,551, craps at $100,315.
Who reports these numbers and when
In Deadwood’s case the source is the South Dakota Department of Revenue, which compiles operator returns and publishes them monthly. Most US gaming jurisdictions work the same way: a state regulator or revenue department collects the data because gaming tax is calculated from it, then releases it on a fixed monthly schedule. Trade outlets then summarise it.
That matters for Indian readers following this space, because there is no directly comparable monthly public dataset for Indian gaming. Anyone tracking the market here works from company filings, tax data and industry estimates instead. US state reports are the closest thing to a clean, audited, month-by-month benchmark of how a regulated casino market behaves, which makes them a useful training ground for reading gaming data in general.
Myth: the headline number is what players wagered
It is not. $17 million is what Deadwood’s casinos kept. The amount cycled through the machines to produce it was many times larger, and the report does not tell you how large. Some jurisdictions publish handle (total amount wagered) alongside win; others do not. If you compare a “revenue” figure from one state with a “handle” figure from another, you will draw a conclusion that is off by an order of magnitude.
The practical rule: before comparing any two gaming numbers, confirm both are measuring the same thing. Gross gaming revenue, adjusted gross revenue, handle and taxable revenue are four different quantities.
Deadwood casino revenue in August: the numbers behind the headline
Here is the August breakdown as reported, which is far more informative than the single growth figure.
| Category | August revenue | Year-over-year change |
|---|---|---|
| Slots (all denominations) | $15.1 million | +9.6% |
| One-cent slots | $12.9 million | +10.2% |
| $1 slots | $814,994 | Not specified |
| City slots | $657,086 | +41.2% |
| 25-cent slots | $340,383 | +27.0% |
| Five-cent slots | Not specified | +27.7% |
| 10-cent slots | Not specified | −52.5% |
| $25 slots | Not specified | −85.6% |
| Table games (all) | $1.8 million | +2.0% |
| Blackjack | $830,757 | +13.6% |
| House-banked poker | $685,551 | Not specified |
| Craps | $100,315 | −54.2% |
Two structural facts jump out. Slots are roughly 89% of Deadwood’s gaming revenue and table games about 11%, so anything that happens on the slot floor drives the market total. And within slots, penny machines are the market. Table games grew, but at 2% they were close to flat and had almost no effect on the headline.
What 8.2% growth actually means
Work backwards. If $17 million is 8.2% above the prior August, the prior August was around $15.7 million, so the increase is roughly $1.3 million in absolute terms. Every percentage change in a revenue report is a ratio against a base you have to identify before the number means anything.
Note also that these are unadjusted year-over-year comparisons of a single month. August 2024 and August 2025 do not contain the same number of weekends, and weekend days are worth more than weekdays in a tourist gambling town. A one or two day calendar shift can move a monthly figure by a percentage point or more on its own, which is why single-month growth figures should never be read as precision instruments.
Myth: the biggest percentage movers are the biggest story
City slots rose 41.2%, the largest gain of any category. That sounds like the headline until you check the base. City slots came in at $657,086, so a 41.2% rise represents roughly $190,000 in extra revenue. One-cent slots rose only 10.2%, but off a $12.9 million base that is roughly $1.2 million, about six times more money.
The same logic applies to the declines. A drop of 85.6% in $25 slots sounds catastrophic. On a high-denomination category with very few machines and a handful of high-stake players, a swing that size can come from removing a bank of machines or from ordinary variance in a small sample. Craps falling 54.2% on $100,315 of revenue is the same phenomenon: low-volume games produce wild percentages because a single big win or loss moves the whole category.
Rule of thumb: multiply the percentage by the base before you react to it. Large percentages on small bases are noise. Small percentages on large bases are the market.
Myth: month-to-month movement shows the trend
Casino revenue is heavily seasonal, and comparing consecutive months mostly measures the calendar. Year-over-year (YoY) comparison, which is what South Dakota’s August release uses, sets August against August and strips most of that seasonality out. Month-over-month (MoM) comparison is useful for cash flow and staffing, close to useless for judging demand.
Deadwood sits in the Black Hills, and August is peak summer tourism season there, including the period of the Sturgis motorcycle rally held nearby. An August figure is therefore not comparable to a February one in any meaningful way. If you see an analysis claiming a market “declined” because October came in below August, that analyst has discovered autumn.
How to compare periods without fooling yourself
- Compare like months year over year as the default.
- Use rolling 12-month totals to see the underlying direction without seasonal noise.
- Check calendar effects: weekend counts, public holidays, festival timing.
- Check whether the comparison base was unusual. Growth against a weak prior year is not the same as growth against a record one.
Myth: rising revenue means more players
A revenue report alone cannot tell you that. A total can rise because more people visited, because the same people spent more per visit, because the floor mix shifted toward games with a higher house edge, or because short-run hold ran above average. Deadwood’s slot revenue rising 9.6% while table games rose 2% is consistent with several of those explanations at once.
Analysts who want to separate these effects look for supporting data the revenue release does not contain: visitor counts, hotel occupancy, number of active machines and tables, and handle where it is published. Without those, the honest conclusion is “revenue grew,” not “demand grew.”
What drives monthly gaming figures
Three forces explain most of the movement in a small-market monthly report.
Tourism and events. Deadwood’s revenue is tied to visitor traffic in the Black Hills. Weather, fuel prices, event calendars and even road construction show up in the numbers. Destination markets swing harder than markets serving a local population.
Consumer spending. Gambling spend is discretionary, so it tracks disposable income, employment and confidence. Interestingly, the denomination data is a spending indicator in itself: penny slots dominating and low-denomination categories growing faster than the $25 machines is the pattern you would expect when players are budget-conscious.
Supply and competition. New properties, renovations, machine counts, closures and the arrival of legal online options all redistribute revenue. A market can grow simply because more machines were switched on, which is why machine counts matter alongside revenue.
Reading between the lines: what Deadwood’s growth actually indicates
Taken at face value, the August report describes a small, slot-dependent market growing moderately, with the growth broad-based across the low-denomination categories that carry most of the volume rather than concentrated in one game. Blackjack’s 13.6% gain shows table demand is not collapsing, even though the table segment overall was nearly flat. The steep declines are all in low-volume categories, which is exactly where you would expect statistical noise rather than signal.
What it does not tell you is whether this continues. One month of casino financial reporting is a data point, not a trajectory, and anyone extrapolating 8.2% forward has left the data behind. The right follow-up is to check the next several monthly releases against the same months a year earlier and see whether the pattern holds.
That is the whole discipline, really: identify what is being measured, find the base behind every percentage, weight the movers by the dollars involved, compare like with like, and resist the urge to build a story from a single month.
FAQ
How do I read a casino revenue report quickly?
Start with the total and the comparison period. Then find the two or three categories large enough to move that total, check their year-over-year change, and multiply the percentage by the base to see the actual money involved. Ignore large percentages on small categories.
What does casino revenue growth mean for players?
Very little directly. It measures how much operators retained, not how any individual fared. Every game carries a house edge, so the house profits over time regardless of whether a market’s monthly total rose or fell.
Is gross gaming revenue the same as profit?
No. Gross gaming revenue (GGR) is money kept from players before gaming tax, salaries, rent, marketing and other costs. Operating profit is a much smaller number and does not appear in a regulator’s monthly release.
Why do regulators publish this data at all?
Because gaming tax is assessed on it. Public disclosure is a by-product of tax administration and licensing oversight, which is also why the data is reliable but narrow in scope.
One closing note: this is market analysis, not investment or betting guidance. Revenue data describes what an industry earned, never what an individual will. If you gamble, set deposit and time limits in advance, treat the spend as entertainment, and use the self-exclusion and cool-off tools your operator is required to provide. Play only if you are of legal age in your jurisdiction.
About the Author